19 Tidying data with pivot_longer()
Reshaping data
The final function we’ll learn in this section on data science is called pivot_longer(). The use of this might seem a bit abstract at first, but I hope it is something you will find very useful in the long run, because it will allow you to apply your data wrangling skills to a much wider pool of datasets.
Data terminology
To understand what it does, we need to back up a little bit. First of all, a bit of terminology about datasets:
- variables can be thought of as the label of a fact, such as eye colour, hair colour, city of birth, and so forth.
- observations are individual instances of that fact, usually a single thing recorded about something. For example, you could record my eye colour and the observation would be ‘The eye colour of Yann Ryan is…’
- Values are the actual measurements for that fact: in this case, the value for this observation would be blue.
Wide and long data
Tabular datasets can usually be described in one of two formats: wide or long.
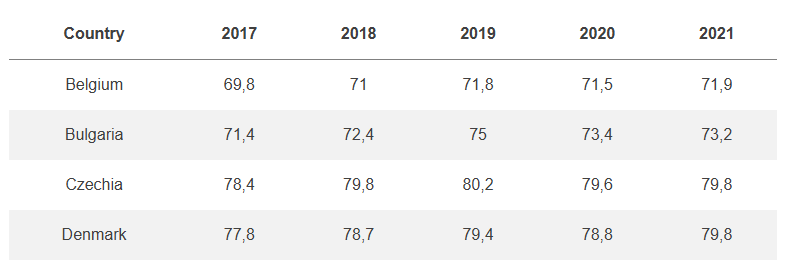
- Wide datasets are where observations can be in columns. For example, if you had a dataset of a group of employment rates and the value for 2017 is in one column, the value for 2018 in the next, and so forth.
- Long datasets are where each observation is in a separate row, like this:
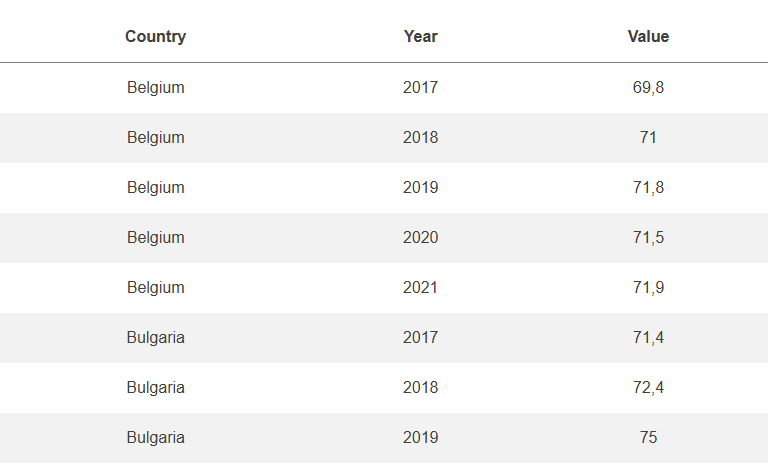
In this case, each individual fact (for example, ‘the employment rate of Belgium in 2017’) has a separate row.
Recording data in this second method is desirable for data analysis (the first is more useful when looking at a table in a spreadsheet programme), as it makes it much easier to work with. Data in this format is also known as tidy.
Tidy data
Tidy data is data where:
Each variable is in its own column.
Each observation is in its own row
Each value is in its own cell.
As an example of a ‘wide’ dataset, there is a dataset called gapminder_population loaded into memory. View it by running the cell below:
This dataset contains population records for countries in Europe. You can see that each country is a separate row, and each year is a separate column. This is not tidy data, because each year is actually a separate observation, and should in its own row.
pivot_longer()
To reshape this to the more useful format, we can use a new function called pivot_longer(). This takes a dataset and a specified set of columns, and reshapes them so that each of these columns now have their own row, repeating the information where needed.
The function has a number of important arguments:
- The dataset to use (or one passed from the pipe)
colswhich lists the columns to reshape. The columns can be selected using the same methods as theselect()function, meaning they can be selected by position, name, and so forth.names_to: what you would like to call the column containing the new variable.values_to: what you would like to call the new values.
See the shape of the data? It now contains far more rows, one for each observation (the population for a given country in a particular year).