Temporal Clusters Browser
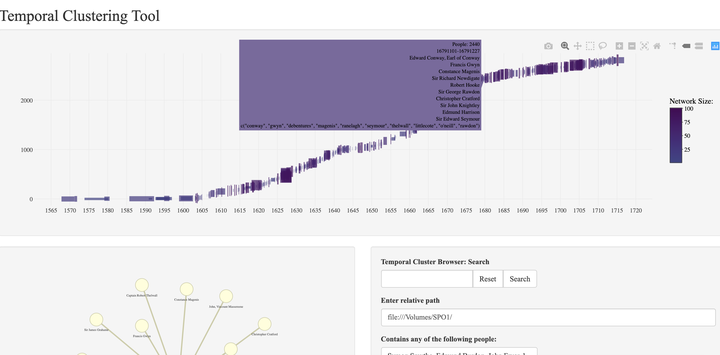 Screenshot of Application
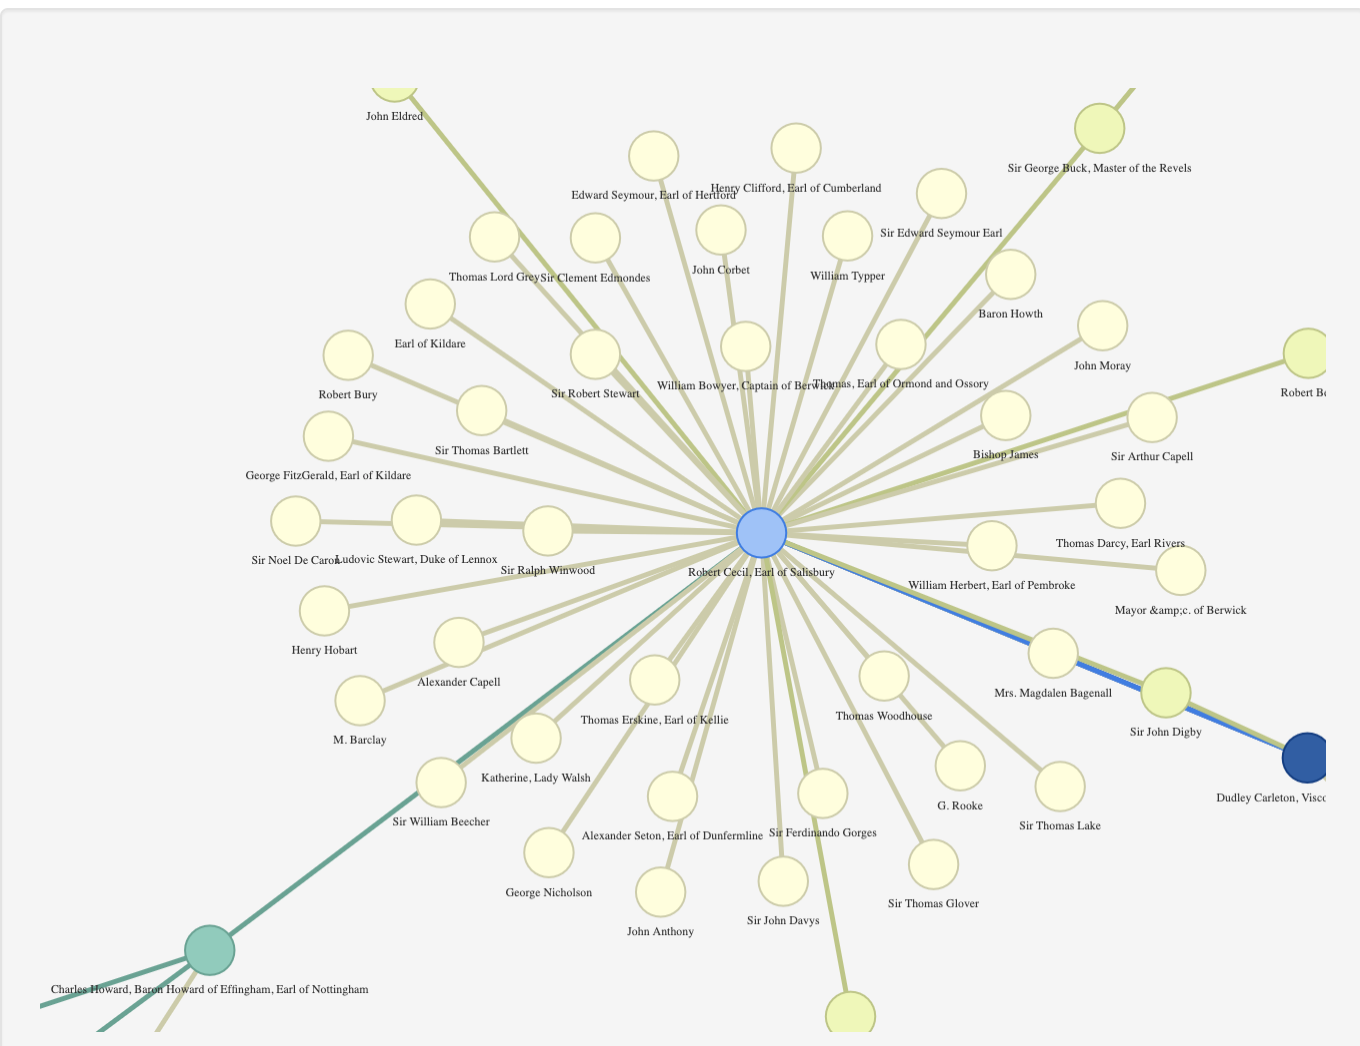
This application was built as a UI layer on top of the results of an algorithm developed by Sebastian Ahnert to detect the presence of short-term temporal clusters in network data.
The application displays all of the detected clusters on an interactive timeline, built using R and Plotly. Clicking on a cluster in the timeline displays an interactive network diagram in a separate pane.
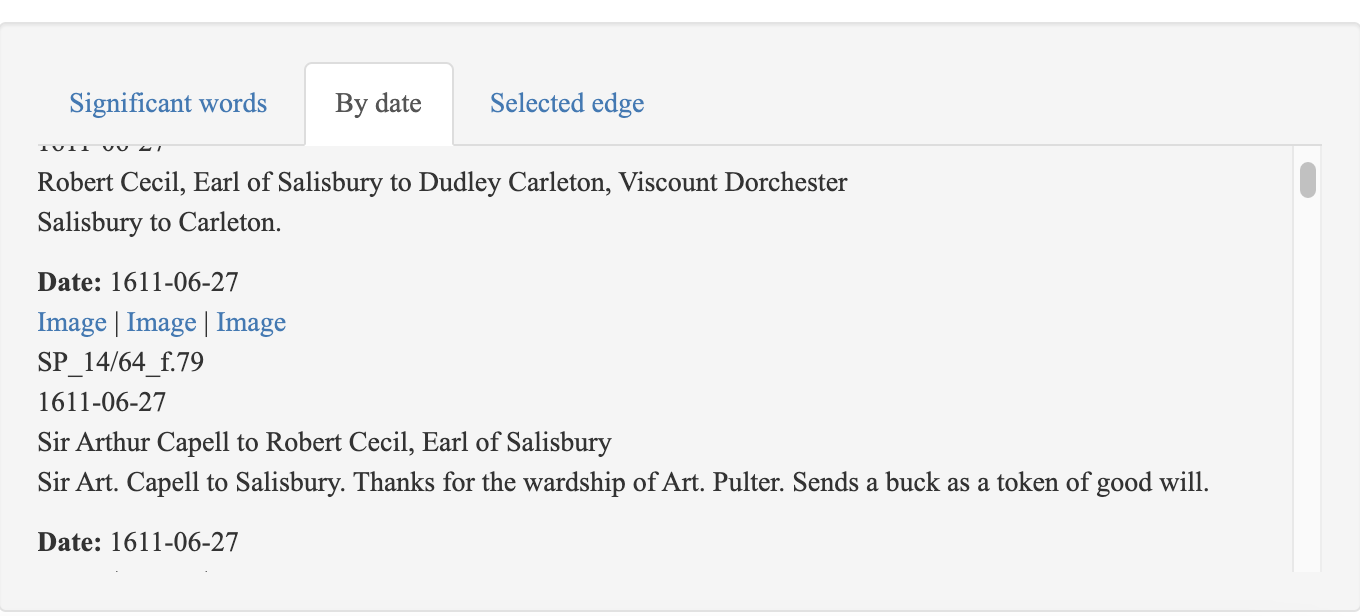
The application also lists the letters belonging to the cluster in order, alongside links to the relevant manuscript images in State Papers Online (if these are available internally). It’s also possible to filter the timeline by keyword or individual.
Yann Ryan
Research Fellow, Networking Archives Project
I’ve been at Queen Mary, University of London since 2014 and recently completed a PhD in the history of early modern news.